

A golf club distance chart lists how far each club carries the ball in the air. In Trackman’s published tour averages for 2023, PGA Tour players carried the driver 282 yards and a 7-iron 176 yards. LPGA Tour players carried them 223 and 143 yards.
A golf club distance chart from tour data
The tables below come from Trackman’s updated PGA and LPGA Tour averages by club, shown here as vendor data. Trackman says the men’s data comes from 40+ events and 200+ players, mostly on the PGA TOUR. The women’s data comes from 30+ events and 150+ players, mostly on the LPGA.
The averages mix shots from competition and the range. Official stat holes were picked in opposite directions to reduce wind effects.
Two things to keep in mind before you use them:
- These are carry distances. Carry is how far the ball flies before it lands. Roll is not included, so these are not driving distances.
- These are tour players. They are not amateur or handicap averages, and no amateur number can be worked out from them.
PGA Tour averages by club
| Club | Club speed (mph) | Carry (yd) | Carry (m) |
|---|---|---|---|
| Driver | 115 | 282 | 258 |
| 3-wood | 110 | 249 | 228 |
| 5-wood | 106 | 236 | 216 |
| Hybrid | 102 | 231 | 211 |
| 3-iron | 100 | 218 | 199 |
| 4-iron | 98 | 209 | 192 |
| 5-iron | 96 | 199 | 182 |
| 6-iron | 94 | 188 | 172 |
| 7-iron | 92 | 176 | 161 |
| 8-iron | 89 | 164 | 150 |
| 9-iron | 87 | 152 | 139 |
| Pitching wedge | 84 | 142 | 130 |
The average distance for hybrid clubs on the PGA Tour was 231 yards of carry, between the 5-wood and the 3-iron. Trackman publishes the meters column itself, so these golf club distances need no conversion.
LPGA Tour averages by club
| Club | Club speed (mph) | Carry (yd) | Carry (m) |
|---|---|---|---|
| Driver | 96 | 223 | 204 |
| 3-wood | 92 | 200 | 183 |
| 5-wood | 90 | 189 | 173 |
| Hybrid | 87 | 178 | 163 |
| 4-iron | 82 | 175 | 160 |
| 5-iron | 81 | 166 | 152 |
| 6-iron | 80 | 155 | 142 |
| 7-iron | 78 | 143 | 131 |
| 8-iron | 76 | 133 | 122 |
| 9-iron | 74 | 123 | 112 |
| Pitching wedge | 72 | 111 | 101 |
The LPGA table has no 3-iron row. Its hybrid carried 178 yards, a little past the 4-iron at 175.
How to read a club distance chart
Each row links clubhead speed to distance. In both tables, a faster club speed sits beside a longer carry, from the pitching wedge up to the driver.
Look at the steps between clubs as much as the driver. Each iron carries a little shorter than the one before it. That steady gap is what lets you pick a club for a yardage.
Launch and spin tell you how the ball gets there. From the 5-iron down, each shorter club launches higher and spins more. The land angle column shows how steeply the ball comes down.
| Club | Launch angle (deg) | Spin rate (rpm) | Land angle (deg) |
|---|---|---|---|
| Driver | 10.4 | 2545 | 39 |
| 5-iron | 11.9 | 5280 | 50 |
| 7-iron | 16.1 | 7124 | 51 |
| 9-iron | 20.0 | 8793 | 52 |
| Pitching wedge | 23.7 | 9316 | 52 |
An average also hides a spread, even on tour. In the R&A and USGA’s research on driving distance, the 10 shortest-ranked players in the 2016 season were about 6% shorter than average. For the 10 longest, the gap above average was about 7%.
How to build your own yardages
Your own distance for each golf club is the number you need on the course. A tour chart can show the shape of a bag, but not your numbers.
- Warm up, then pick one club and a target at a known yardage.
- Hit several balls and note where most of them land, not your longest one.
- Write down that typical carry, then move to the next club.
- Check the gaps. Two clubs that carry about the same may do the same job.
Do this on more than one day before you trust a number. The driving range practice plan shows one way to split a bucket across clubs.
What Striped measures behind the numbers
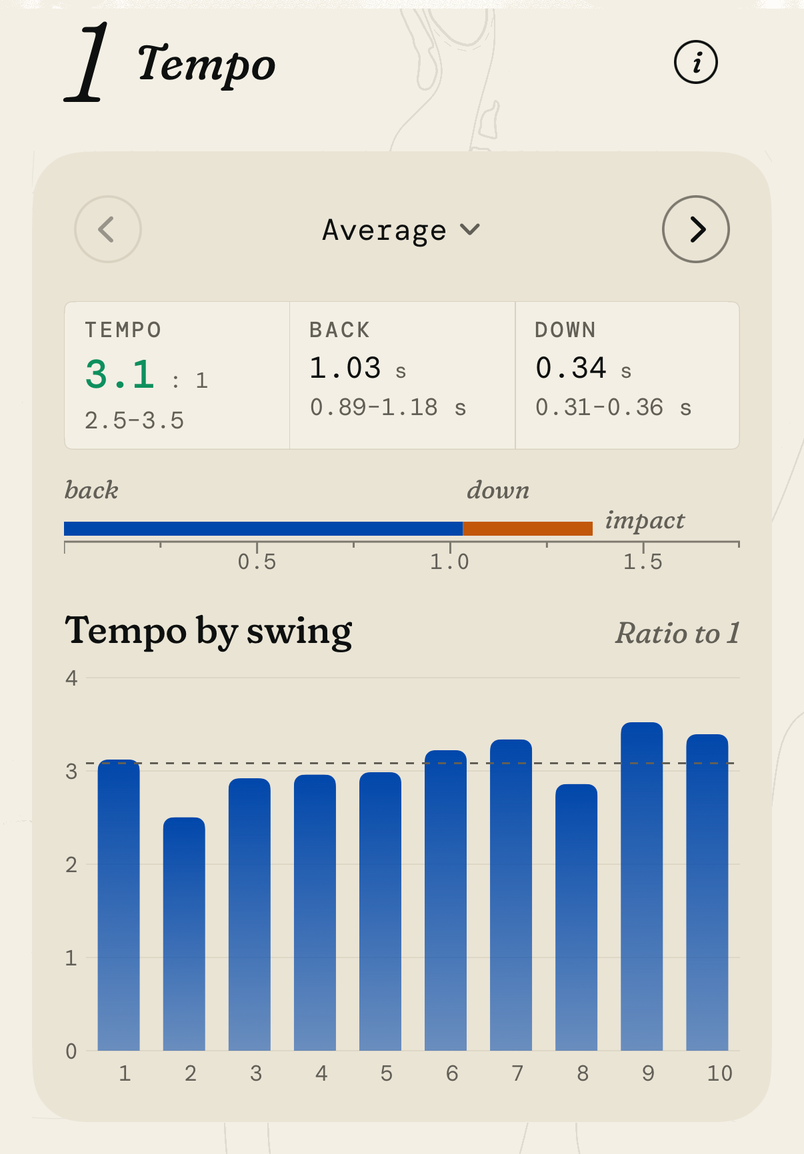
A distance chart describes the club and the ball. Striped reads the body motion behind them, with your iPhone in your pocket, AirPods and Apple Watch. It measures your tempo, hip turn, head movement, swing plane and hand path.
A steady tempo can help your contact, and steady contact can help your carry numbers repeat. Striped times your hands. Apple Watch on your lead wrist finds the top where your hands reverse.
In one 7-iron session, the backswing took 0.85 s and the downswing 0.29 s, a tempo ratio of 2.9 (example swings from one session). The golf tempo guide explains what the ratio means.
| Measure | Value |
|---|---|
| Backswing | 0.85 s |
| Downswing | 0.29 s |
| Tempo ratio | 2.9 |
Striped uses three devices together, and each Irons session keeps your swings sorted by club. That lets you check your rhythm club by club as you build your yardages.
Put your iPhone in your front pocket, your AirPods in, and Apple Watch on your lead wrist. Profile Devices shows whether your Apple Watch is ready.
On the Practice screen, choose Irons. Irons sessions are labeled by club.
Turn on spoken shot labels, then say the club, such as “seven iron,” to tag each swing.
Hit your balls, then stop the session from iPhone or Apple Watch.
Open the report. Tempo, Back and Down show the average. Step to a swing to see its own.
Open Progress to compare days. Each point is one club’s average for a practice day.
The Striped home page shows what else the report measures.
Sources
- New PGA & LPGA Tour Averages (Trackman)
- Research on Driving Distance in Golf Published (The R&A)
- Striped: Striped times tempo at the hands. The top is where the hands reverse, read by Apple Watch on the lead wrist.
- Striped: One 7-iron session (3 swings), tempo at the hands. (example swings from one session)
Cite or embed
Cite this guide: Nick. “A golf club distance chart from tour averages.” Striped, 4 Nov 2026. https://stripedgolfapp.com/guides/golf-club-distance-chart/
